Data visualizations
This page gathers some interactive web applications that I have designed and developed (with my colleagues and students). These Shiny web applications are hosted on SK8. This page also includes some older data visualizations.
Interactive web applications
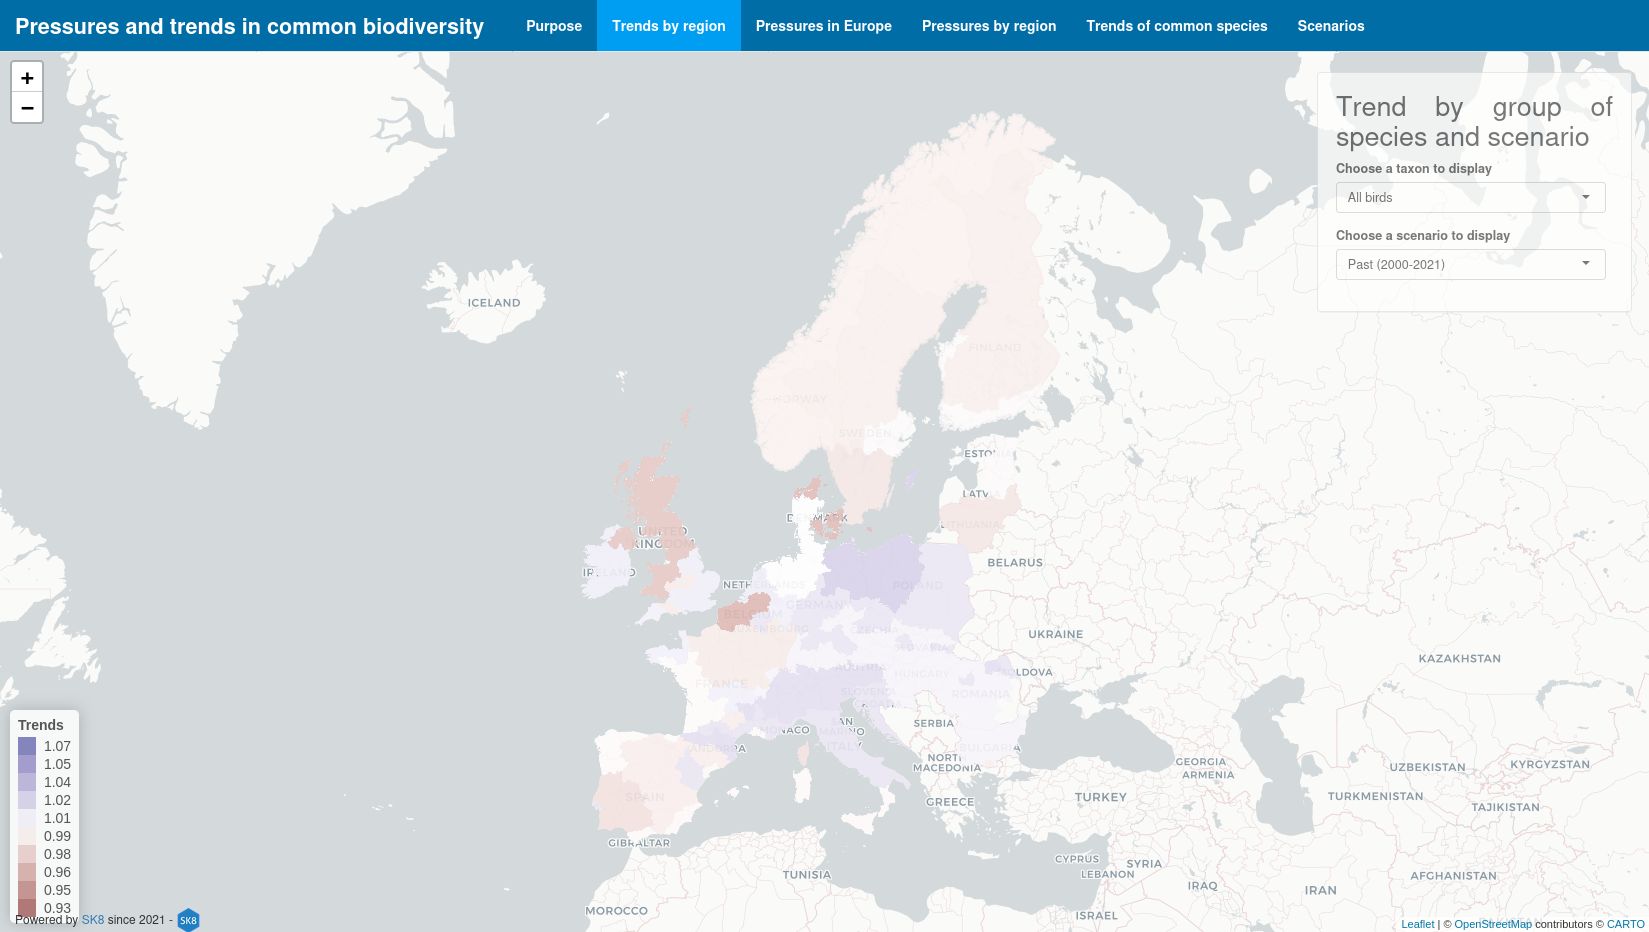
PressComBio
is an interactive web application designed to visualize the effect of direct
pressures on trends of common birds and butterflies in Europe and the
spatialisation of changes in those trends among future scenarios across Europe.
Open science:
[paper]
[SK8]
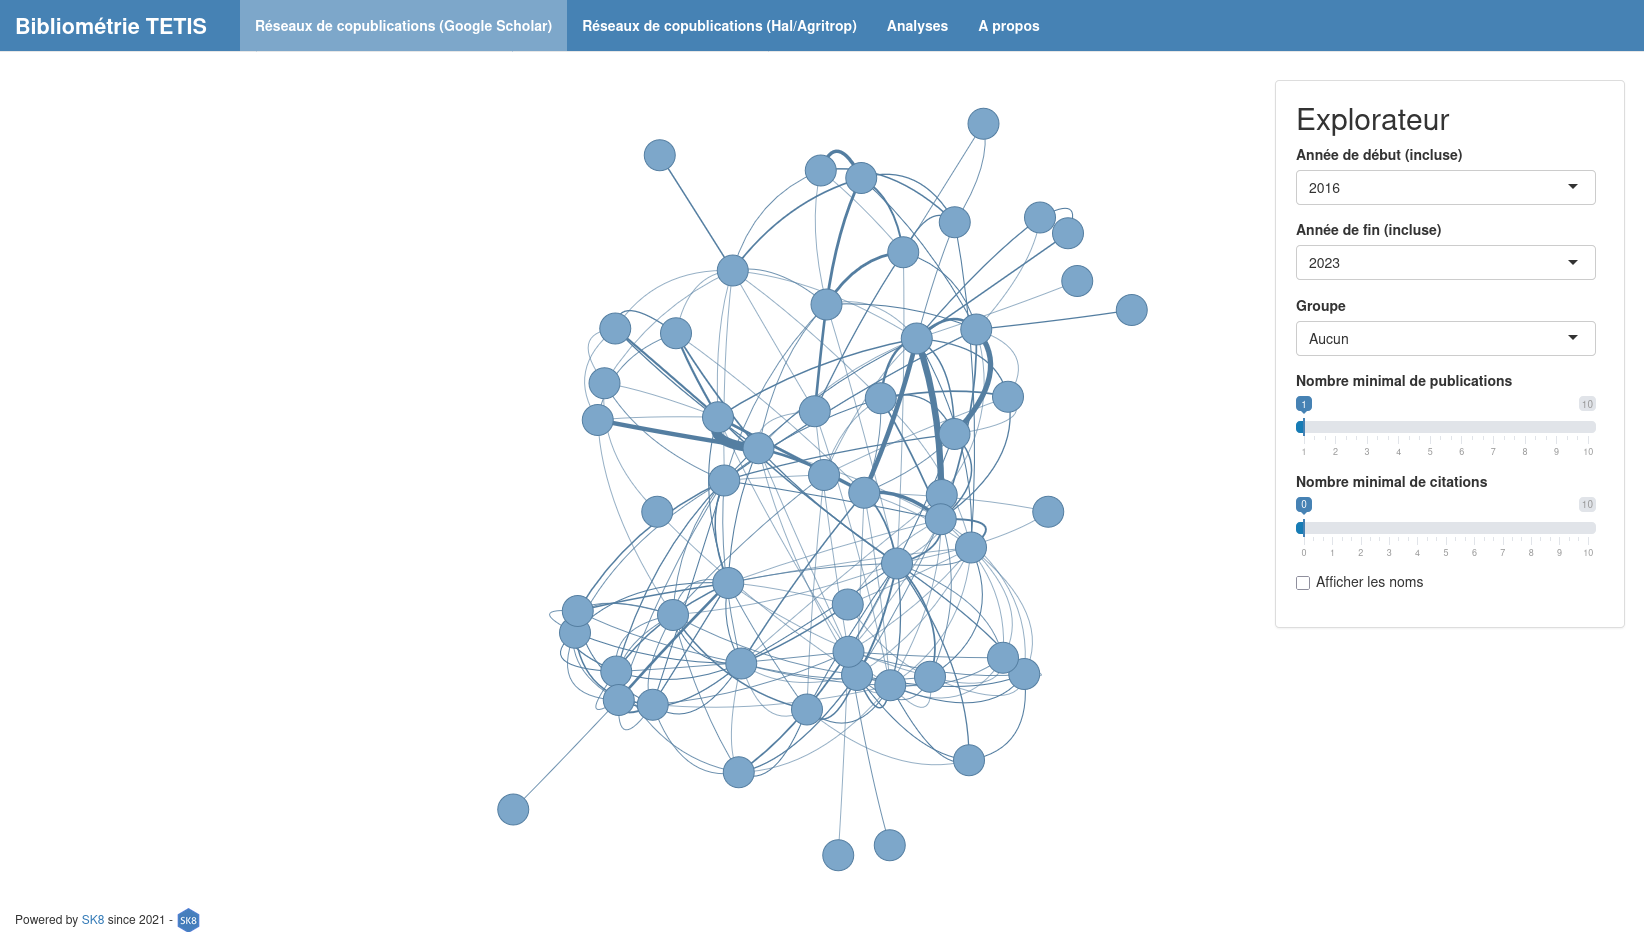
Biblio-TETIS
is an interactive web application providing a bibliographic analysis of
publications (journal articles and conference papers) from the UMR TETIS
between 2016 and 2024.
Open science:
[repo]
[SK8]
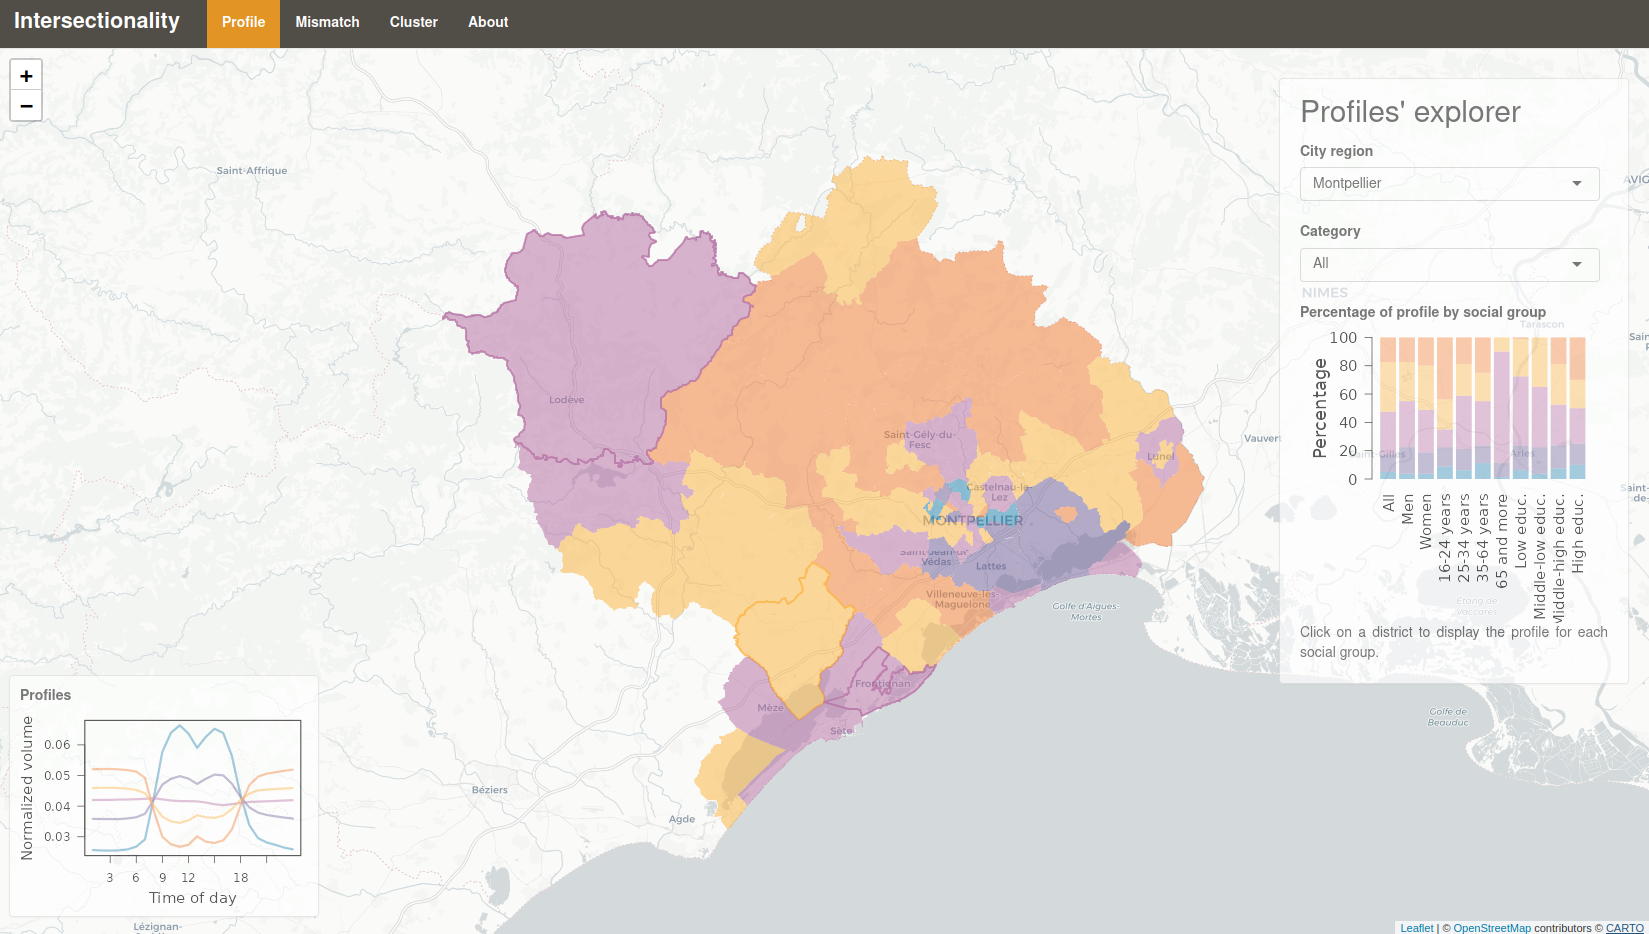
Intersectionality
is an interactive web application designed to provide an easy-to-use interface
to visualize the gender-, age- and educational-based mismatch in hourly
population profiles at district level in France.
Open science:
[repo]
[paper]
[SK8]
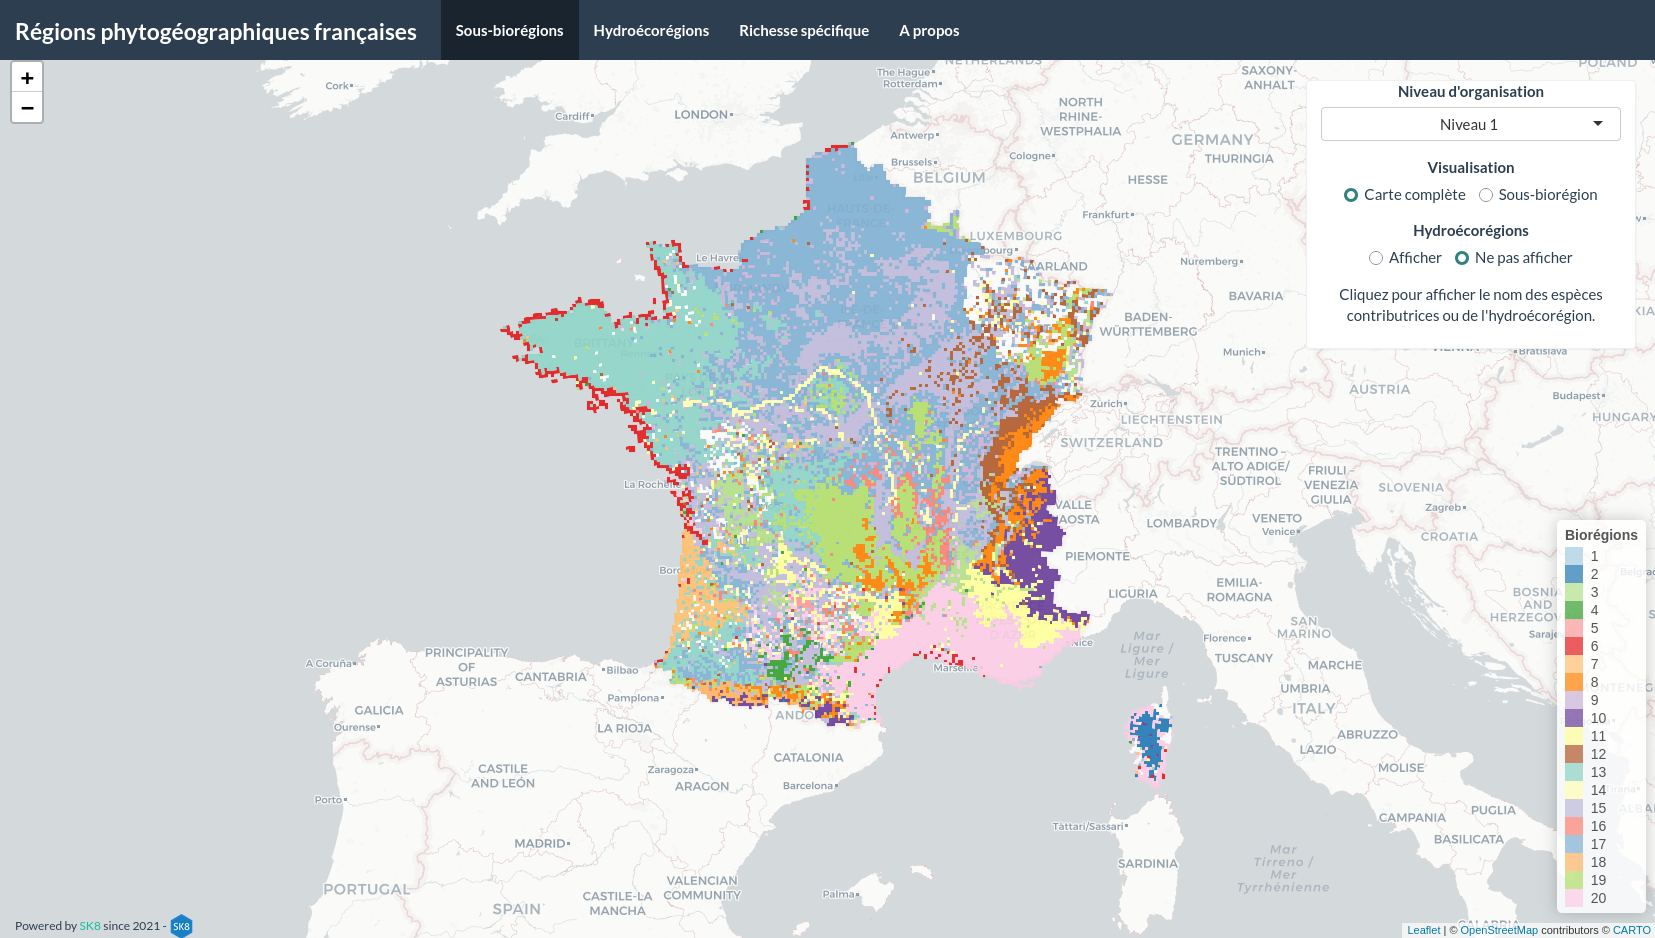
BiogeoFr
is an interactive web application designed to provide an easy-to-use interface
for visualizing the major phytogeographical regions of mainland France.
Open science:
[SK8]
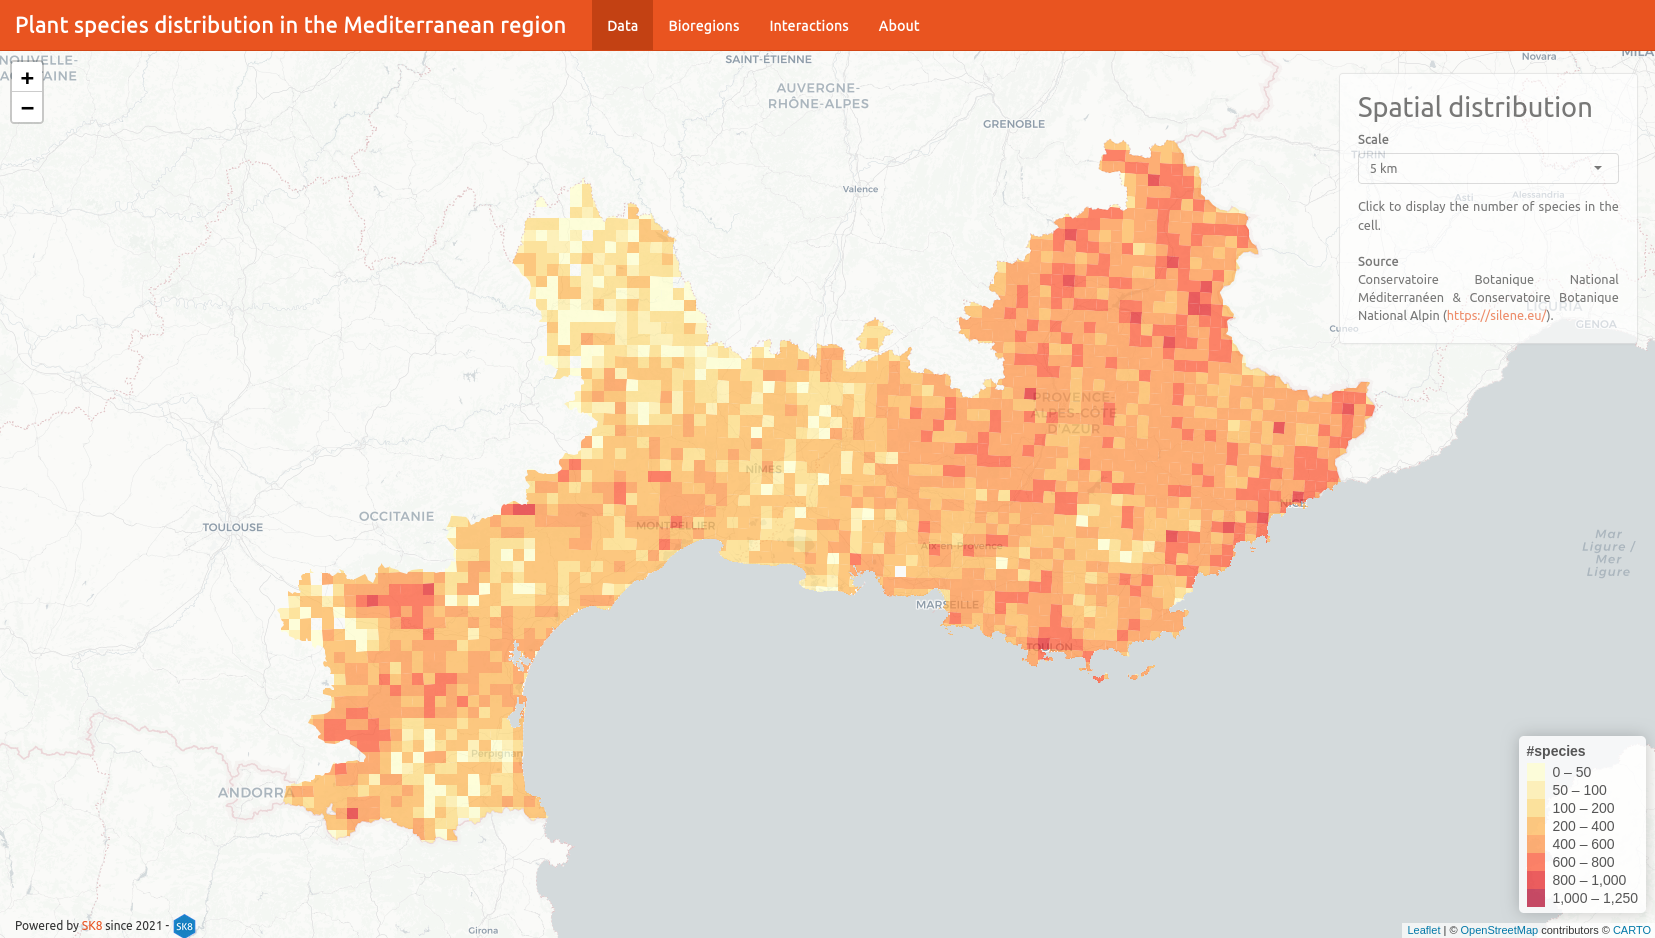
BiogeoMed
is an interactive web application designed to provide an easy-to-use interface
for visualizing multiscale biogeographical structures of plant species
distribution in the south of France.
Open science:
[repo]
[paper]
[SK8]
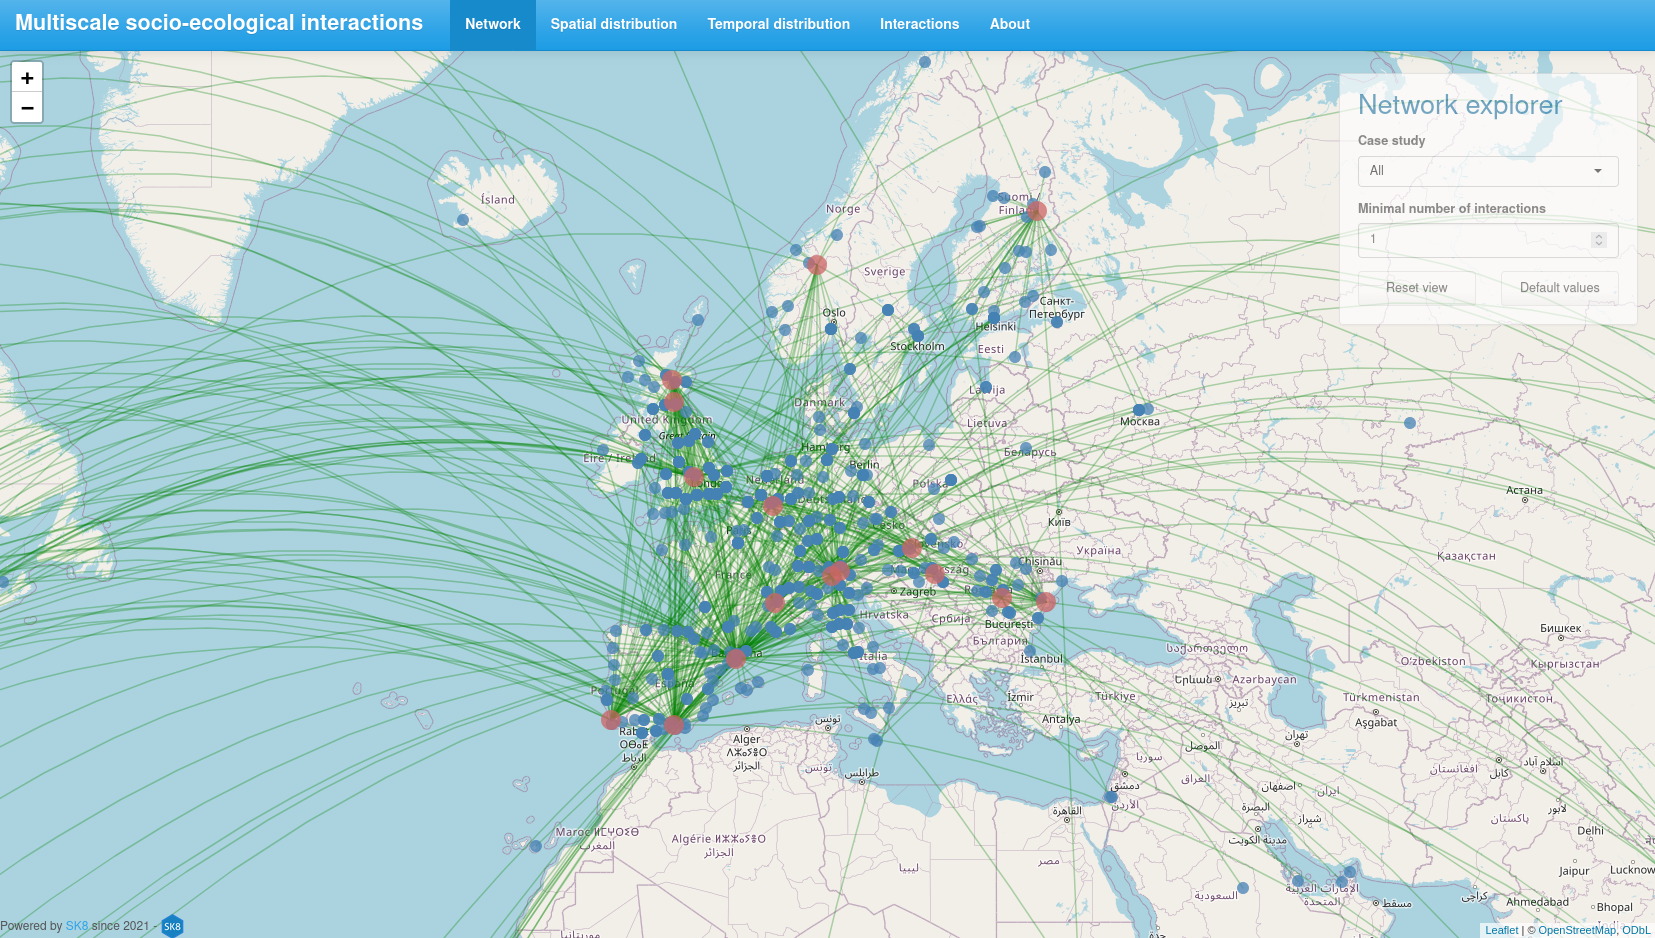
AHIA
is an interactive web application designed to provide an easy-to-use interface to
visualize socio-ecological interactions at different scales in 16 case studies
across Europe.
Open science:
[repo]
[paper]
[SK8]
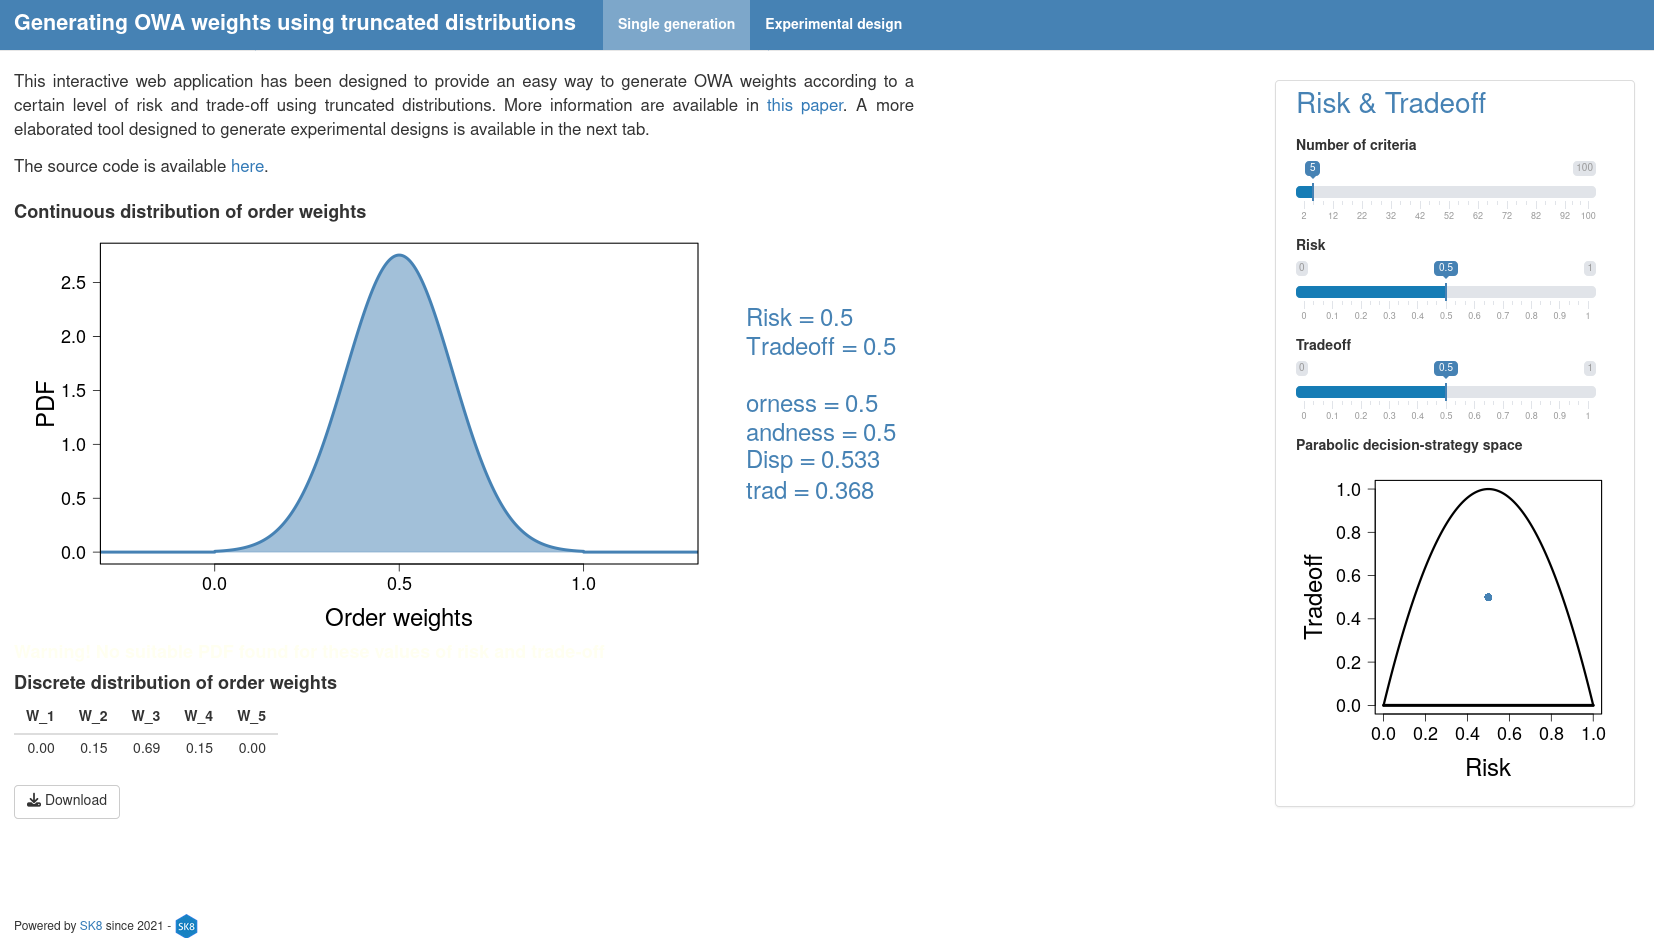
OWA
is an interactive web application designed to provide an easy way to generate
OWA weights according to a certain level of risk and trade-off using
truncated distributions.
Open science:
[repo]
[paper]
[SK8]
Old stuff
Hotspots
